
Charting your progress
 |
| Ed Henninger |
Tired of running political cartoons on your opinion page ... especially political cartoons that have little to do with what's going on in your town?
Here's an idea worth considering: A weekly reader opinion poll.
Instead of the cartoon, you run the poll results in a prominent position on your opinion page.
I can think of two immediate advantages to a reader poll:
- You increase reader interest in your opinion page.
- You get your readers directly involved in your community dialogue.
One other advantage: By placing the poll question on your website, you increase reader traffic there.
Some points to consider (with the most important point first!):
YOU CAN DO IT: Creating a poll chart isn't difficult. If you have Microsoft Excel or Apple's Numbers, the applications can pretty much build the chart for you after you input the numbers. And you can create a spreadsheet template that you can use week after week. If you need some help with the software, I'll bet there's someone in your office already using a spreadsheet/charting app. Odds are they'll be happy to create the charts for you.
ASK OPEN-ENDED QUESTIONS: Nothing's more boring than a poll with "yes" and "no" responses. They may give you a sense of reader opinion on the topic, but "yes" and "no" responses won't let you know the depth of reader feelings.
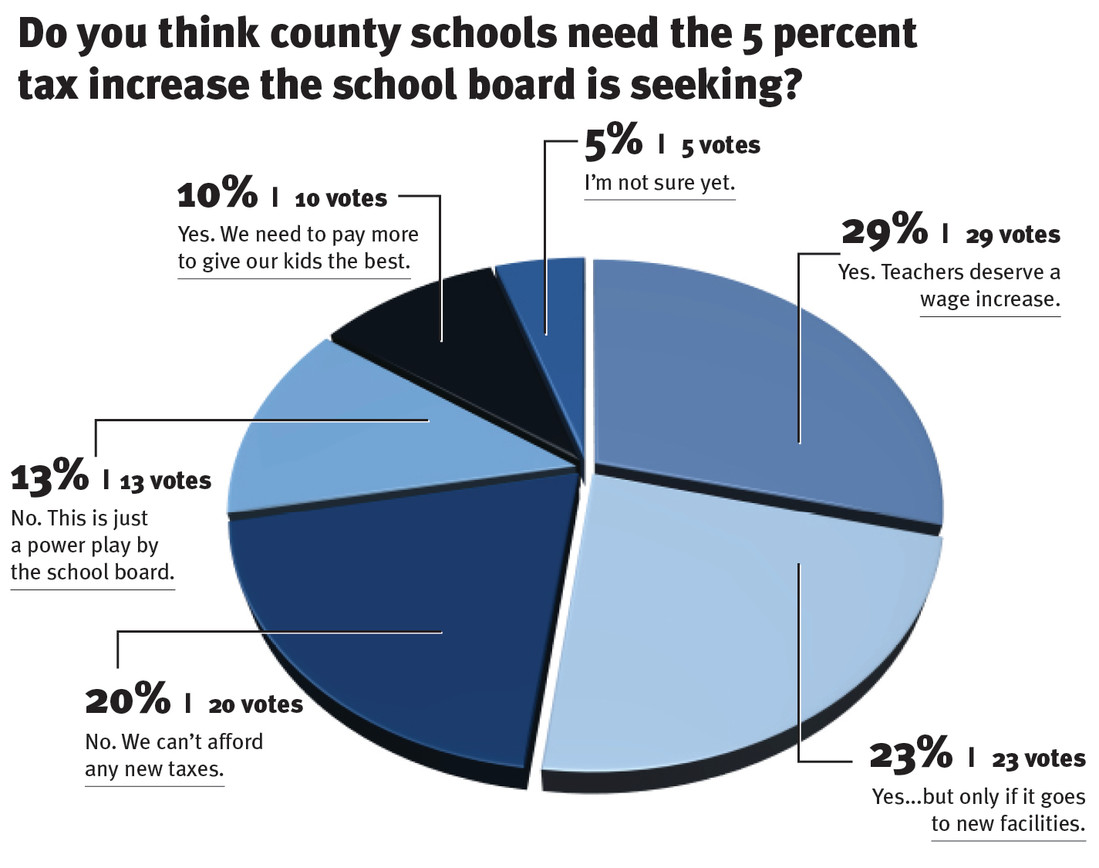
OFFER AT LEAST FIVE OR SIX RESPONSES: Take a look at the responses in the illustration with this column. Offer readers the chance to pick from a mix. If you know the topic well enough (and you should!), you'll know the best choices to place in front of readers.
ENCOURAGE COMMENTS: Offer readers the opportunity to write a comment or two, and run those comments below the poll.
ASK ON THE WEB: With each poll, include a web address where readers can go to respond. Give them a teaser to the questions, not the full questions, to encourage them to go to the web page.
ANSWER IN THE PAPER: Run the results of your poll (and reader comments, as mentioned above) in print. This drives readers to your opinion page.
KEEP IT CURRENT: As in the illustration, keep the poll up to date with what's going on in your community.
KEEP IT LOCAL: Readers care less about what's going on in Washington than they care about what's going on in your county.
CHECK THE NUMBERS: Make sure the numbers are spot-on. There's nothing more embarrassing than poll numbers that add up to more than 100 percent.
WATCH THE COLORS: Don't use every color in the rainbow. That can create a gaudy look. Instead, consider an approach that uses tints and shadows of the same color, as in the illustration.
CONTROL THE TYPOGRAPHY: Stick with different fonts of the same type family ... perhaps the same fonts you use for your headlines. Don't get "creative" here. Make the chart as readable as possible.
You can create a reader poll chart every week. It takes some planning and it takes some thinking to come up with your list of suggested responses, but it can become a great reader grabber for your newspaper – and your website.
WANT A FREE evaluation of your newspaper's design? Just contact Ed Henninger: edh@henningerconsulting.com | (803) 327-3322
IF THIS COLUMN has been helpful, you may be interested in his books: "Henninger on Design" and "101 Henninger Helpful Hints." With the help of his books, you'll immediately have a better idea how to design for your readers. Find out more about "Henninger on Design" and "101 Henninger Helpful Hints" by visiting his website: www.henningerconsulting.com
ED HENNINGER is an independent newspaper consultant and the director of Henninger Consulting. He offers comprehensive newspaper design services including redesigns, workshops, staff training and evaluations. E-mail: edh@henningerconsulting.com. On the web: henningerconsulting.com. Phone: (803) 327-3322.
Keywords
Henninger, design


